
Home
Getting started
Bring your software with Docker
Core concepts
How-to guides
Monitor and debugging
Developer tools
Glossary
Documentation HPCTasq is the best way to simply keep track of your tasks and monitor their progress.
Here is how you can monitor your tasks.
The Tasks tab displays a list of all your tasks and prints some information about them. You can change the way they are sorted.
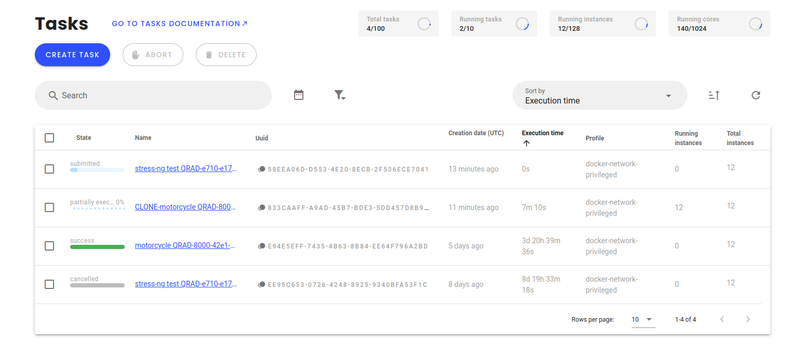
Among the most relevant information are Sate and Execution time. The latter is the sum of the execution time on each instance, e.g. the time that will finally be invoiced. The former contains the status of the task. Here are the possible values and their meaning:
This may be due to the fact that you have reached your running instances limit.
Most of the time it isn't a measure of progress. Indeed, if all the instances have similar loads, or if you have only one task, all the instances should start and finish at the same time so it will jump from 0% to 100%.
However Success only means that the process finished normally on Qarnot's side of things. The program you started may have failed anyway. If needed, see the Debugging your payloads section.
By clicking on an element of the list, you can have very useful details about the task. In addition to general information such as the task's UUID, the profile, constants and links toward your buckets:
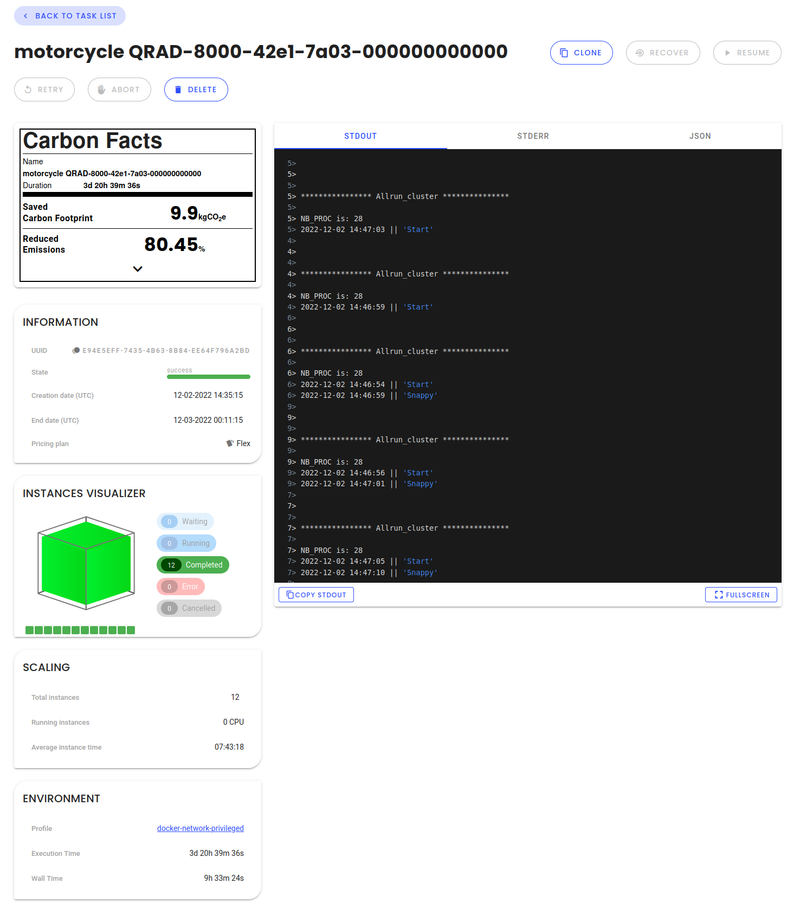
The central pane displays the task's standard output on the 1st tab and its standard error on the 2nd tab.
These are reported in a best effort. They may not be exact, and sometimes the API can't follow the output, so [...] may appear. As explained in the Fetching logs page, you may want to log all the outputs into a file, and optionally use snapshots to follow them and make sure you get all the logs.The 3rd tab, JSON, shows the raw answer given by the API. The format isn't really user-friendly, yet the syntax is rather straight forward. Some interesting information can be retrieved. See the next paragraph to learn more about them.
In the panels Scaling and Environment are indicated how many instances are in the task and how many are currently running. It also tells two time measurements whose meanings are the following:
All these data are also present in the JSON, in section "status". In it there is also a drill-down of the total Wall time into several sections: download, environment, upload.
By hovering the squares in instances visualizer, you can have access to the CPU model, the CPU usage and the RAM usage. Once the task is finished, these indicators are replaced by the execution time and the RAM peak usage.
More information is available in the JSON file:
perRunningInstanceInfo you can see for each instance, live information such as the maximum and minimum core frequency, memory used and memory usage rate, etc. executionTimeGHz is equal to the time spend by cores frequencies. Thus, it is a measure of elapsed clock cycles.executionTimeByCpuModel and executionTimeGhzByCpuModel you can see information for finished tasks per CPU model.completedInstances you can have access to precise execution time and average frequency.If your task has lasted more than one hour, a panel with carbon metrics will appear. Metrics at account-level are also accessible in your account settings.
For more information on Monitoring and debugging please consult the following articles